
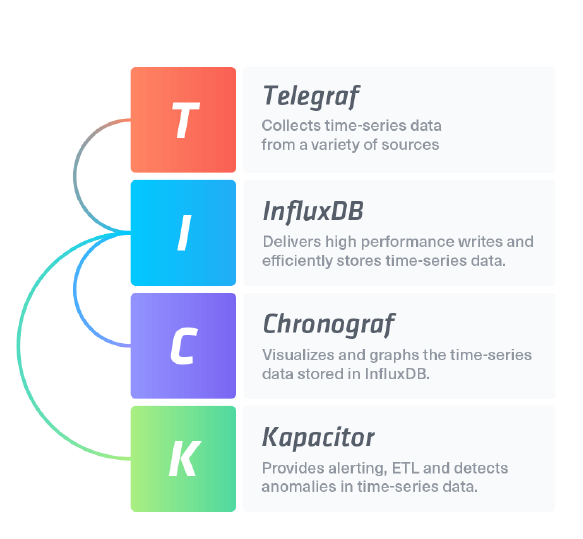
TICK Stack
If you observe the word TICK, you might get a doubt as to why the word is capitalised. Yes, it is an abbreviation. So, we all know that every abbreviated word is done only if we can elaborate it with its respective letters. Likewise, the term TICK comprises four technologies associated with it. To define TICK Stack, it is a collection of associated technologies combined to deliver a platform for storing, capturing, monitoring, and visualising the time series data. The technologies that comprise TICK are listed below.
- Telgeraf – A collection of sequential tie data from a range of sources, including IoT devices.
- InfluxDB – An efficient and high-performance database store for handling high volumes of time-series data.
- Chronograf – A real-time visualisation of InfluxDB data.
- Kapacitor – Monitoring and alerting based on the views of InfluxDB data and anomalies that contain within those views.
While considering the aspect of collecting data, unlike Prometheus, which is a pull model, the TICK Stack is the push model. InfluxDB component is the best time series of the databases, which is the heart of TICK Stack. TICK Stack is backed by InfluxData, and it requires an enterprise version for some features like DB Clustering. But, fairly, it is a good choice for monitoring. Many companies are using TICK Stack in a few production places, and they had a good experience with it.
The basic Feature set of TICK
Telegraf
It is a plugin-driven server agent for metrics collection and reporting. Telegraf plugins source various metrics directly from the systems it runs on, metric pulling from the third-party APIs, or to listen for metrics even via a Kafka and StatsD consumer service. It also contains the output plugins to send metrics to a variety of other datastores, message queues, and services, including Graphite, InfluxDB, Datadog, OpenTSDB, Librato, Kafka, NSQ, MQTT, and many others.
- InfluxDB
InfluxDB is a time-series database built from the ground level for handling high write and query loads. InfluxDB is a customized high-performance datastore written for time-stamped data specifically, and especially helpful for use cases such as DevOps and IoT monitoring, and also real-time analytics. Maintain space on your machine by configuring InfluxDB to store data for a defined period of time, and to expire and delete unwanted data from the system automatically. Also, InfluxDB offers a SQL-like query language for data interacting.
- Chronograf
Chronograf is the visualization engine and administrative user interface of the stack. It is quick and simple to set up and maintain the alerting and monitoring of our infrastructure. Using chronograf is quite simple and includes templates and libraries that allow us to build dashboards rapidly with real-time visualizations of the data and to easily create automation and alerting rules.
- Kapacitor
Kapacitor is a native data processing engine, and it is capable of processing both stream and batch data from InfluxDB. Kapacitor lets us plug in our own custom logic or user-defined functions to process alerts with dynamic thresholds, compute statistical anomalies, match metrics for patterns, and perform specific actions depending on these alerts, such as dynamic load rebalancing. Kapacitor integrates with OpsGenie, HipChat, Alerta, Sensu, Slack, PagerDuty, and more applications.
Who can use TICK Stack?
TICK Stack is a helpful technology stack for:
Admins
TICK Stack is a useful tool for the system administrators because it aggregates the multiple host information in one place by making it possible for the flexible dependency visualization and selection. The notifications of TICK Stack saves the administrators time and helps them to respond only to the highly relevant ones.
Developers
A huge plugin count like MS SQL, MySQL, RabbitMQ, Elastic Search, and more can help the developers to keep track of their narrow areas in the software product usage and can increase the efficiency of work.
Customers
This tool helps the customers to identify the low efficiencies of individual sections of the infrastructure, load prediction, and optimize the server expansion strategies. Resultantly, the customer can be aware of how the services are used efficiently and tailoring them on their needs accordingly.
Why should one use TICK Stack?
When you feel the alternatives are so expensive, have bad clients, lack of features, you need control over managing the data, or just simply interested in a promising tool for the time-series data, one can use the TICK Stack.
Reasons behind to use TICK Stack for monitoring
Open-Source and Cheap
The only cost that you should bear is the hardware that you run it on InfluxDB’s hardware sizing guideline and the time that we put in setting up.
Works with the StatsD clients
We simply need to switch the host your StatsD client points, if we’re using StatsD.
Soup-to-nuts monitoring
We can collect, store, visualize, and alert on our data with a stack designed to work together. We don’t need to struggle with integrating services built by separate teams.
Time-series data, not just metrics
TICK Stack is made for time-series data, which includes the metrics, but isn’t limited to it. Many of the users faced various types of time-series data the past few years working with the Big Data space (monitoring, analytics, sensors, anomaly detection, and other use cases of time-series data) and felt the tools are on lack of something. So hopefully, TICK testifies to be a useful tool in the toolbox.
A simple TICK Stack and server connections are represented in the below image.
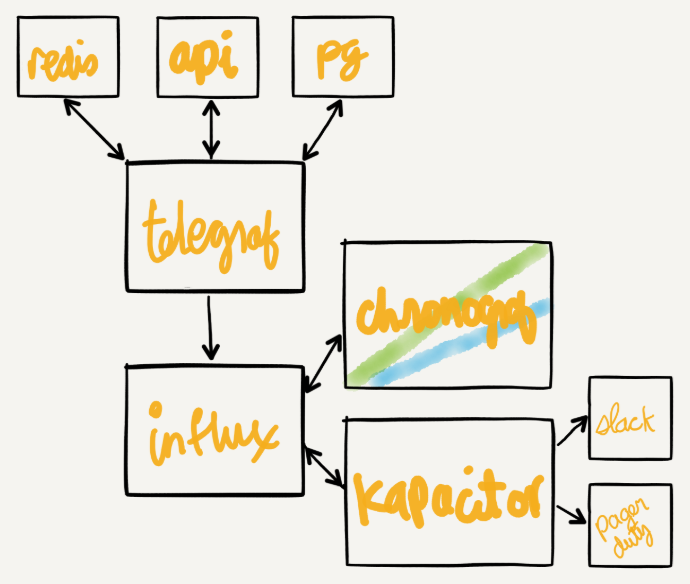
Telegraf integrates and pulls the stats from all service kinds
Redis, Elasticsearch, StatsD, PostgreSQL, and much more. Telegraf makes light of the work in pulling the metrics from all our infrastructure into a single place.
Chronograf’s design
The design looks clean, nice, and is easy to use.
Chronograf’s SQL-like query language
No clicking via a bunch of long menus to set up our visualizations and queries.
Kapacitor’s TICKscript
We can write our alerts or any type of event in the declarative code. It’s pretty and powerful stuff. Kapacitor supports sending events to services like PagerDuty, Slack, webhooks, and more.
Conclusion
TICK Stack is the less cost-effective and an easy to implement monitoring service compared to the other ones. The TICK Stack can be implemented using multiple technologies or domains like Kubernetes, Prometheus, and with multiple Operating Systems like Windows, Ubuntu, and more. Ultimately, we can consider TICK Stack as a widely used monitoring tool in multiple aspects.
Our company, ScriptBees, offers various services in terms of TICK Stack with a tailored procedure.
Sharing is caring!